I created data visualisation which is about UN Sustainable Development Goal.
This data visualisation had to consider one or more of Klien and D’Ignazio’s six principles of Feminist Data Visualisation practice (2016).
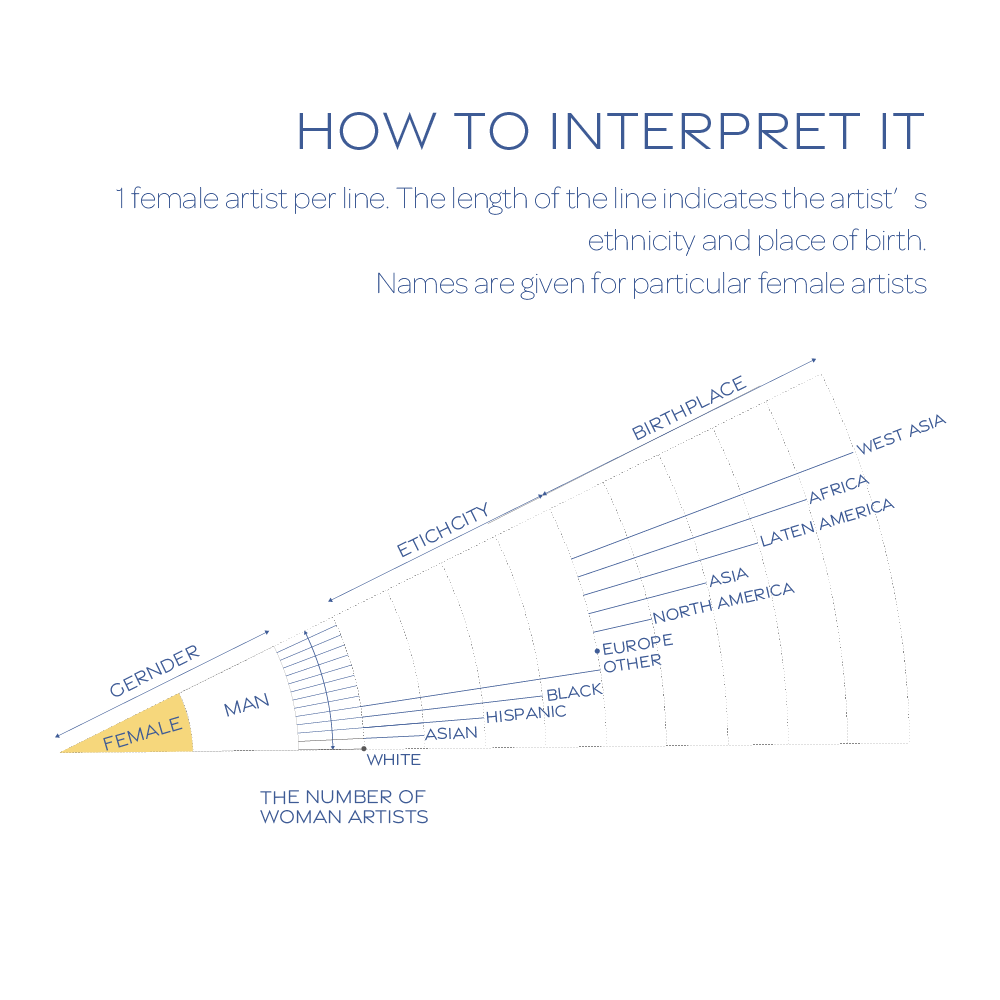
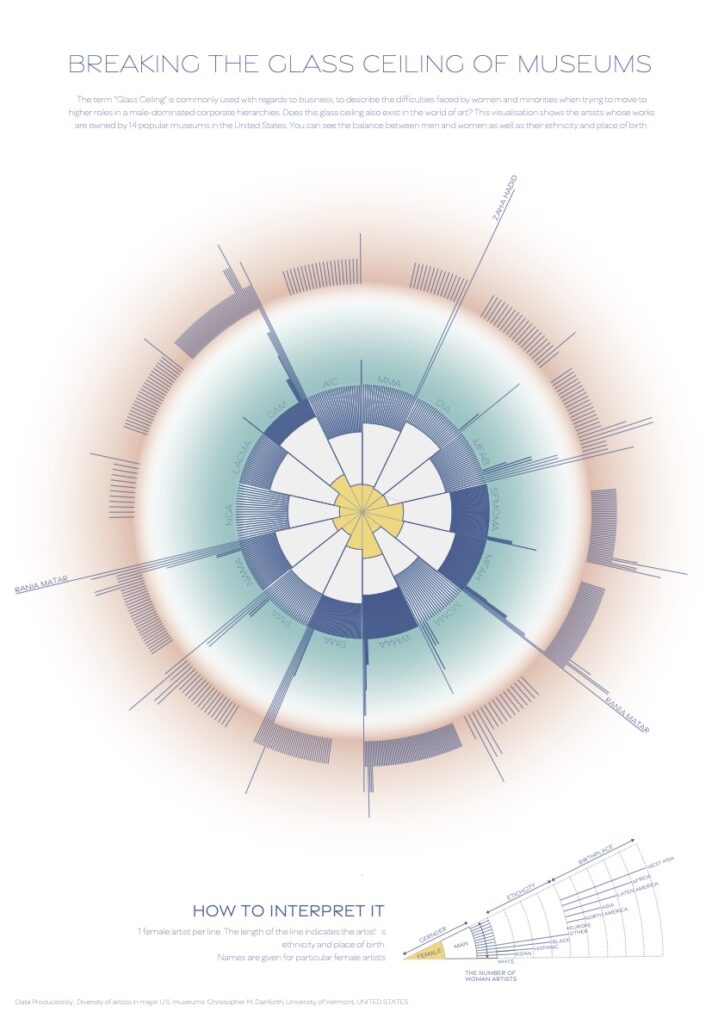
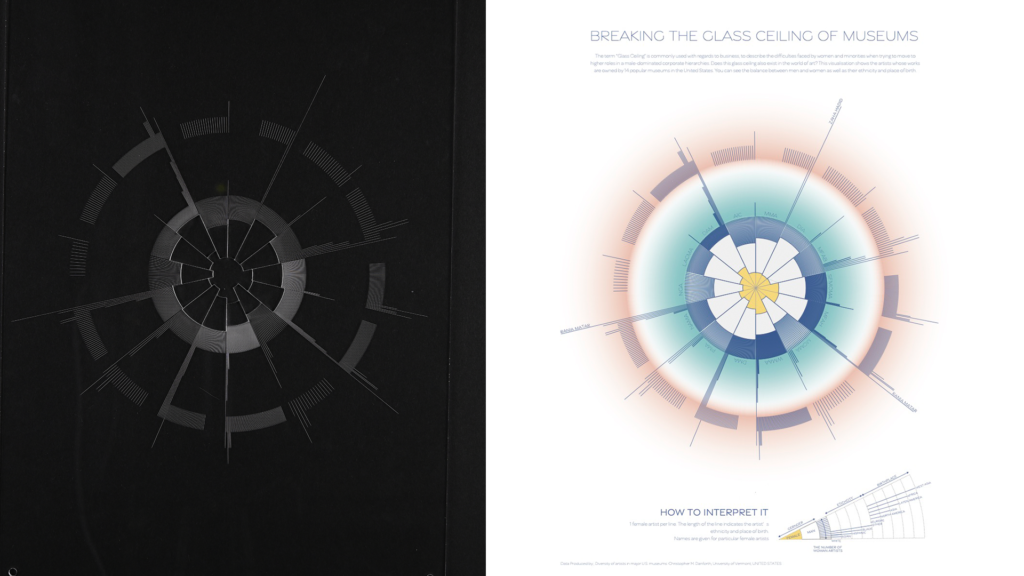
The word “Glass Ceiling” is commonly used with regards to business, to describe the difficulties faced by women and minorities when trying to move to higher roles in a male-dominated corporate hierarchies. Does this glass ceiling also exist in the world of art? This visualisation shows the artists whose works are owned by 18 popular museums in the United States. You can see the balance between men and women as well as their ethnicity and place of birth.
I chose “dataset 5 Achieve gender equality and empower all women and girls” as UN Sustainable Development Goal.
I found artists dataset of 18 famous museums in the United State which is collected by Christopher M. Danforth, University of Vermont, UNITED STATES.
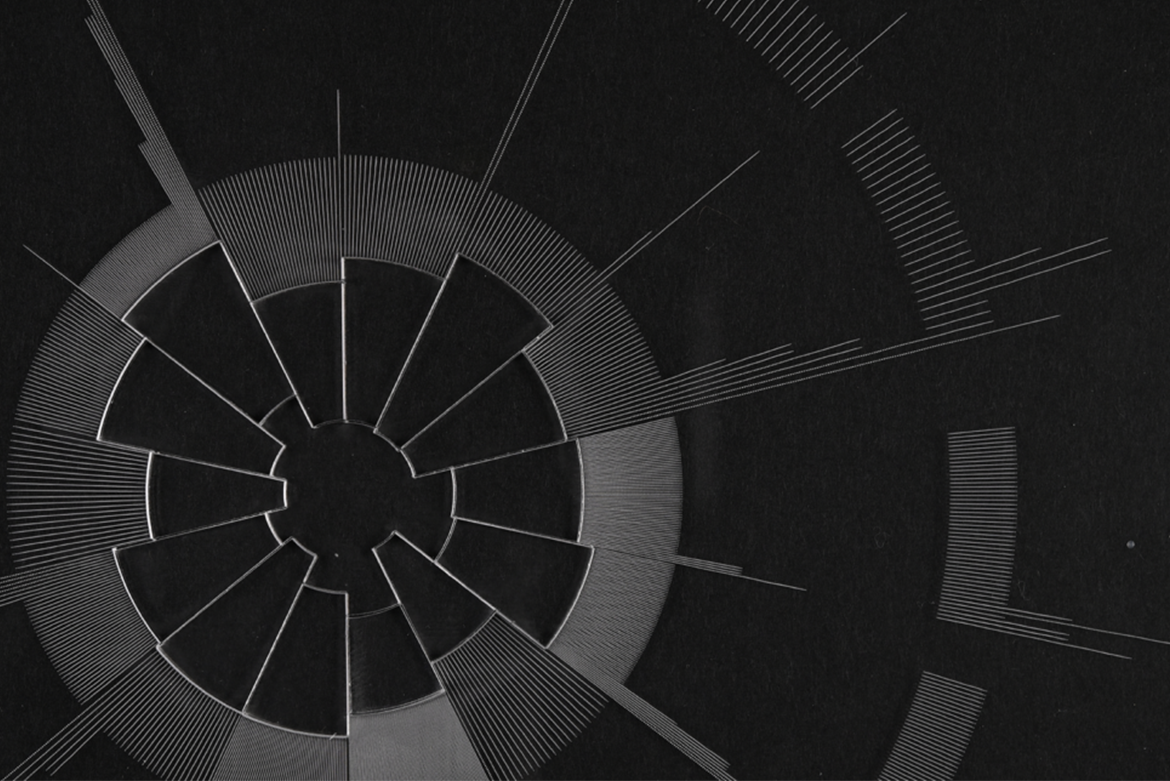
When I thought the emotion which is caused by “break ceiling”, One thing is “Destruction”. sometimes glass is seemed cool and doesn’t have a emotion. color image is gray, black etc. Another one is “Light”. Light sometimes shows positive impression such as hope and warm. These two have a opositte meaning.
I tried to express these two by shape and color.