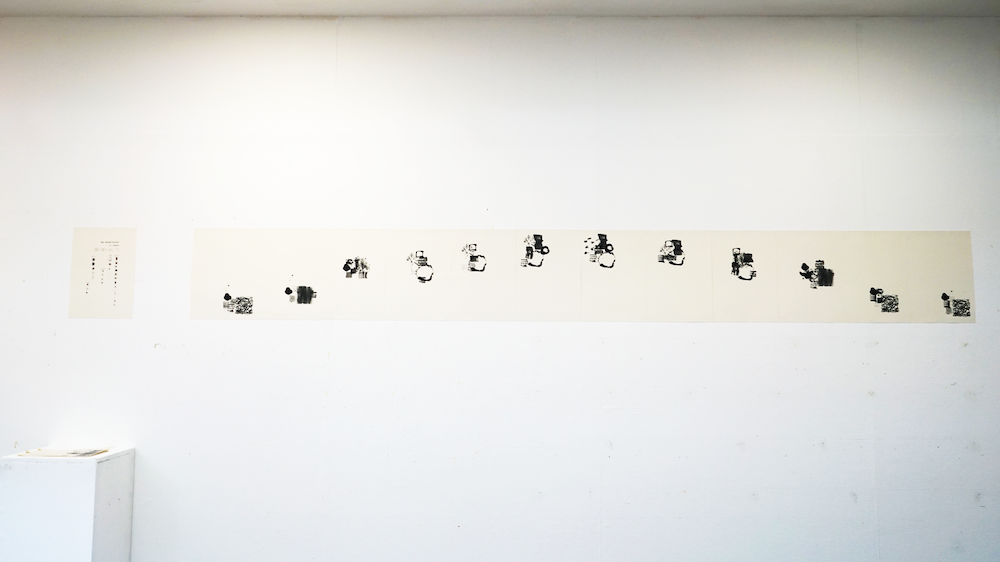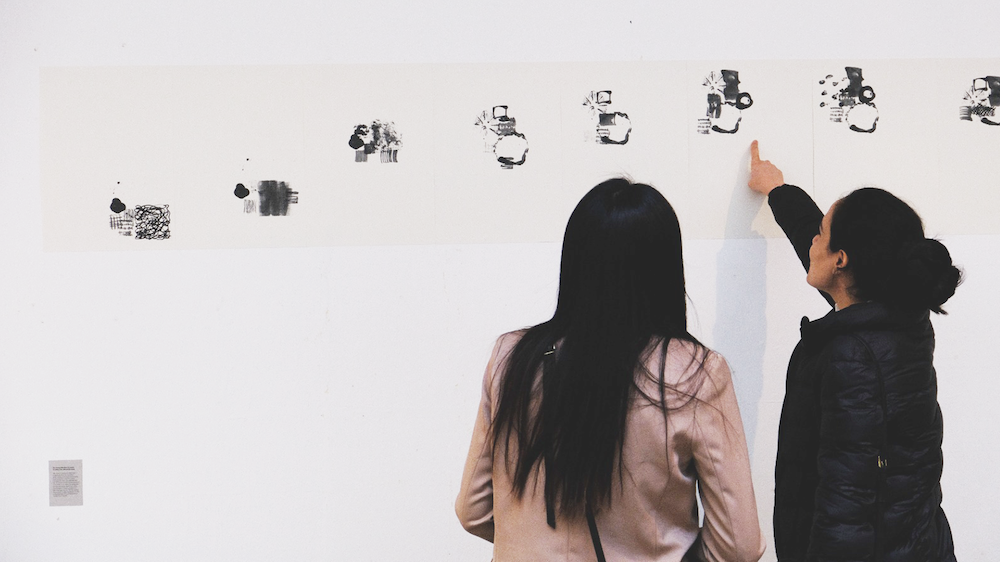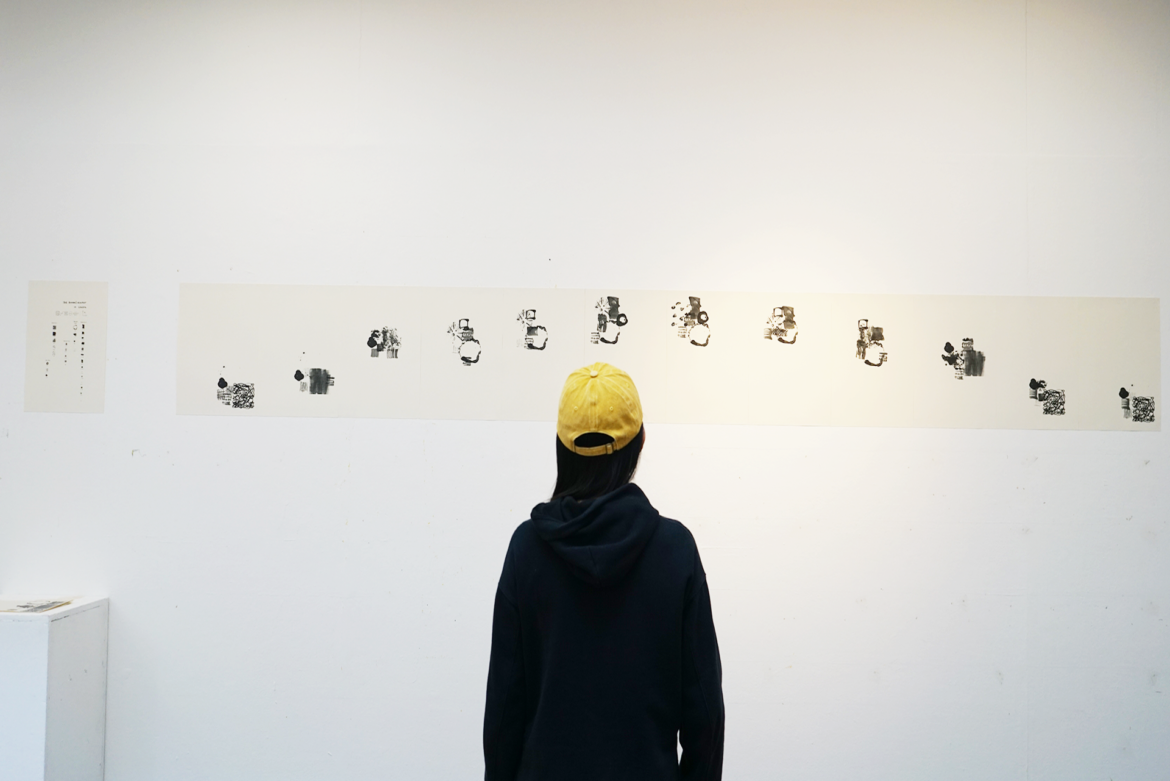
This outcome is inspired by Wabi – Sabi a philosophy from Zen Buddhism which centers on the belief that showing truth come from observing nature. The approarch sees and celebrates the beauty of the imperfect, impermanent and incomplete. In our output we categorised our visual language experiments using a combination of visual variables and Wabi – Sabi approaches. We then applied this approach to data visualisation to offer a documentation and our perspective on the weather is such as key part of the natural phenomenon.
shapes I used are visual languages by organic materials such as woods and fabric.
‘wabi-sabi definition is not clear because it means subtleties of mood, vagueness, and logic of the heart. However, there exsits “Material qualities principle”. We focued on the material features of each element and categorized by combining this princiles and Visual Varuables by Jacques Bertin.
Weather is one of phenomenon of natural. We decide to use the annual weather data in london and made a group by ‘Humid’, ‘Type of weather’, ‘Tempurature’, ‘Rain fall’ and ‘Sun hours’.
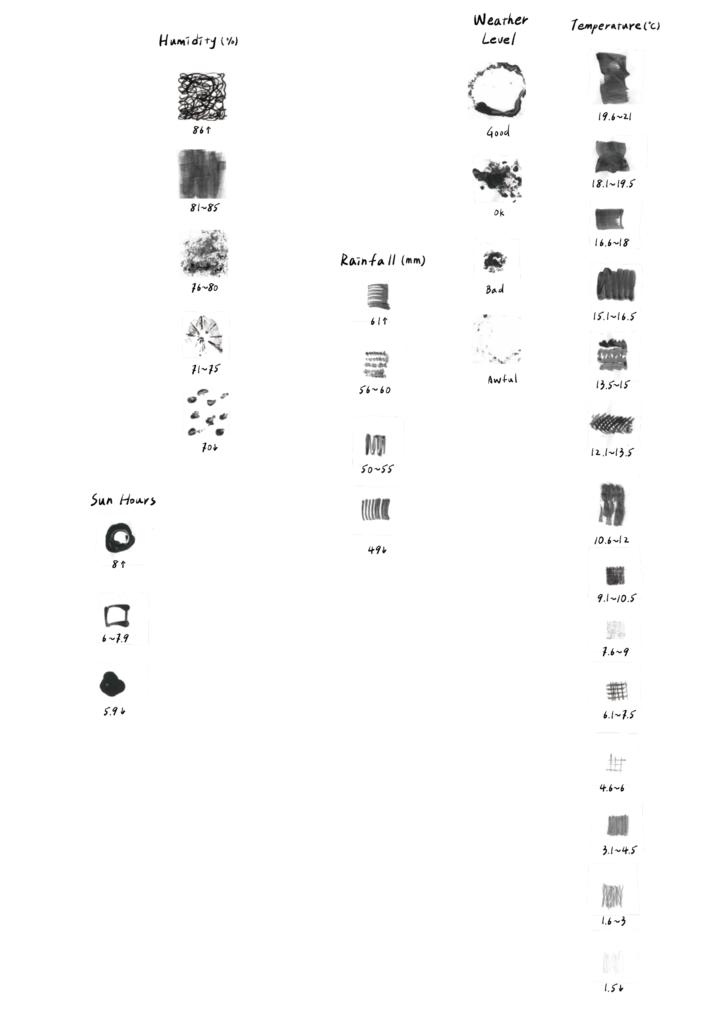
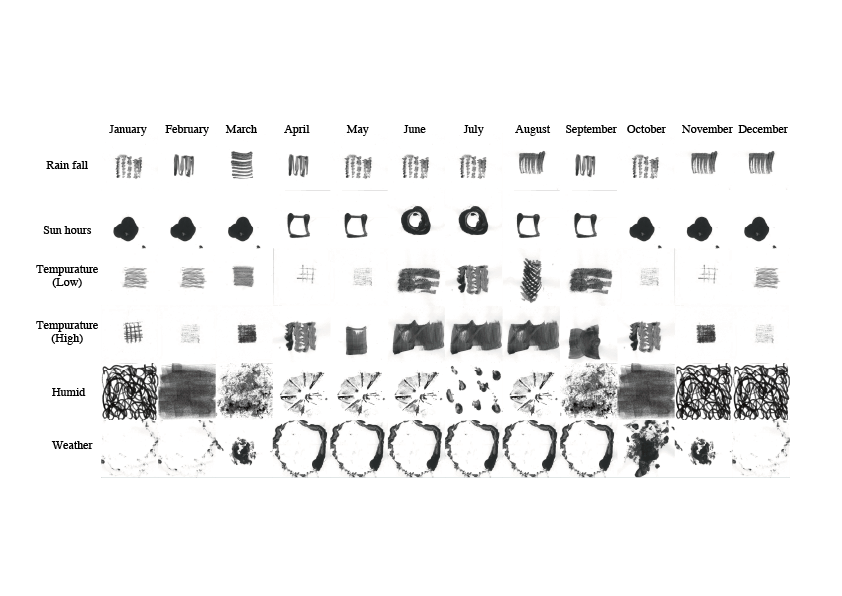
Put each legends by rules
To put legend in the same shape, we make the rules of position below. 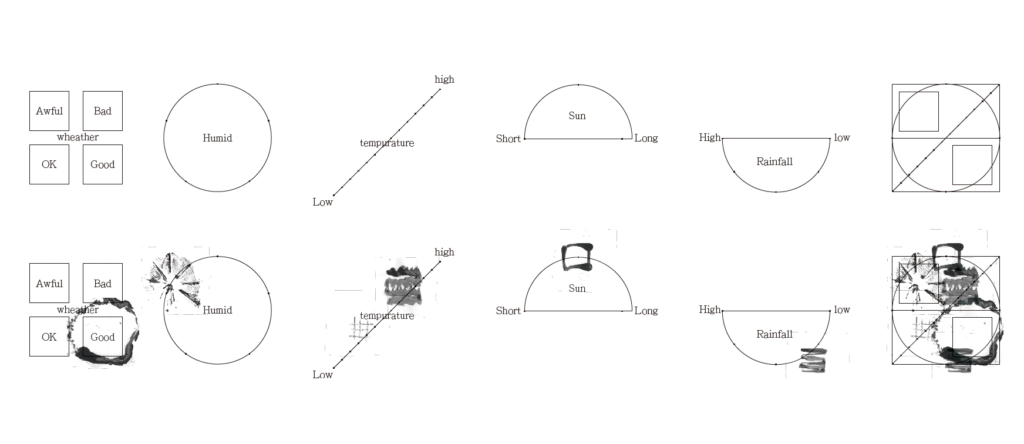
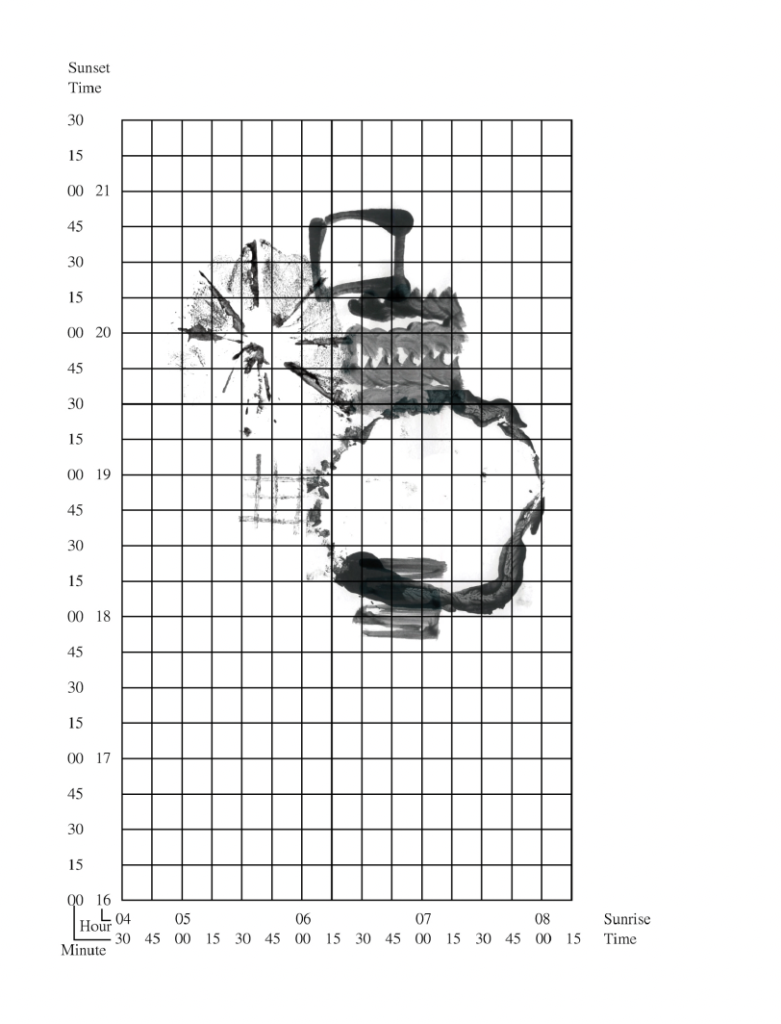
Line up each month legend from January to Decenber.
