Breaking the Glass Ceiling Of Museums (2023)
I created data visualisation which is about UN Sustainable Development Goal.
This data visualisation had to consider one or more of Klien and D’Ignazio’s six principles of Feminist Data Visualisation practice (2016).
Context
As I am a woman, I decided to use the United Nation’s data on Women’s Equality to be used.
Also, as a creator of the artwork, I decided to look for data on female artists in the museum collection and use data that would be more conducive to considering the position of the parties involved.
Design
I approached my designs from a humanist expression through the use of warm colours and the visual metaphor of ‘breaking glass.
Technology
The data was created using the Processing programming language, and then laser processed onto an acrylic plate to create the visual impact of broken glass.
Concept
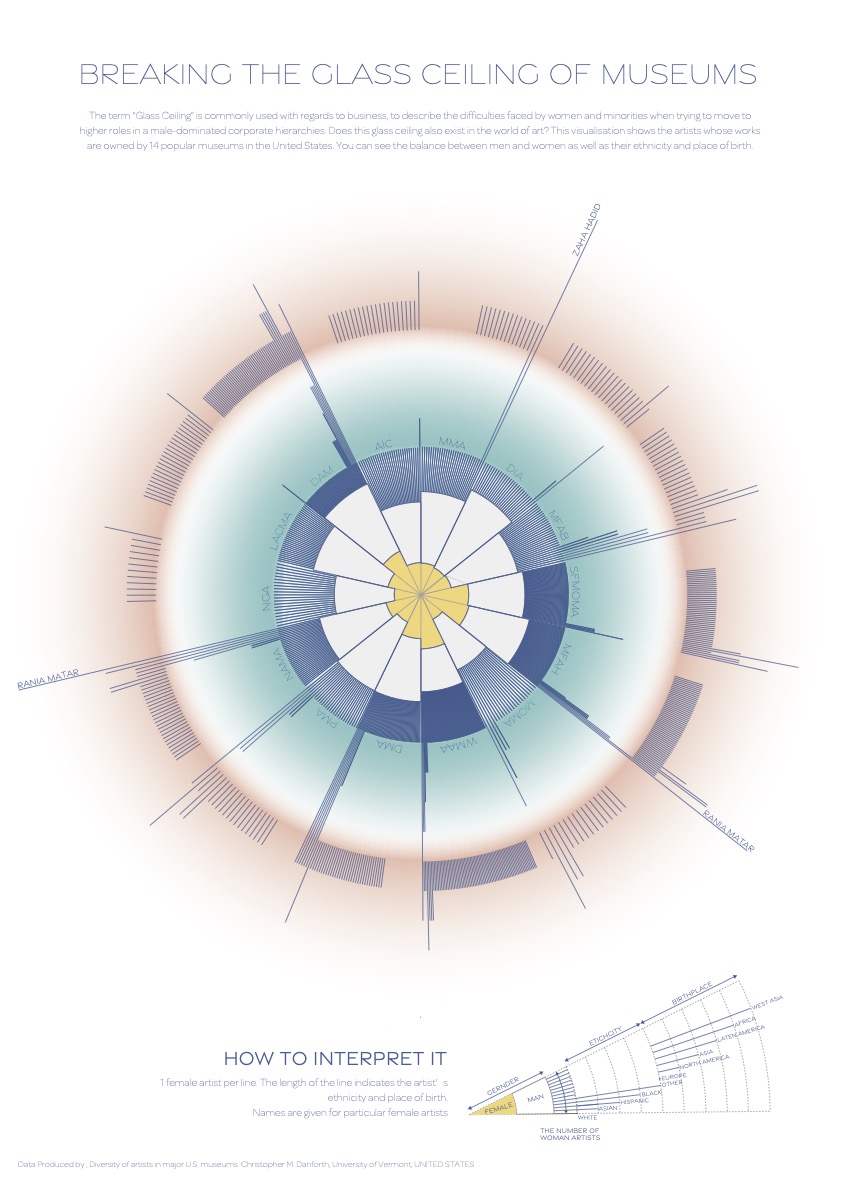
The word “Glass Ceiling” is commonly used with regards to business, to describe the difficulties faced by women and minorities when trying to move to higher roles in a male-dominated corporate hierarchies. Does this glass ceiling also exist in the world of art? This visualisation shows the artists whose works are owned by 18 popular museums in the United States. You can see the balance between men and women as well as their ethnicity and place of birth.